
All what can be performed using the extrapolation toolkit can also be perform using review scripts to automate the process.
In this section, you will find some examples of review scripts to use for this kind of purpose.
PZT Disc Example Model:
Here's a simple PZTDisc Example model with an extrapolation output surface which generates a ".*flxext" file that can be used to perform extrapolation post-processing:
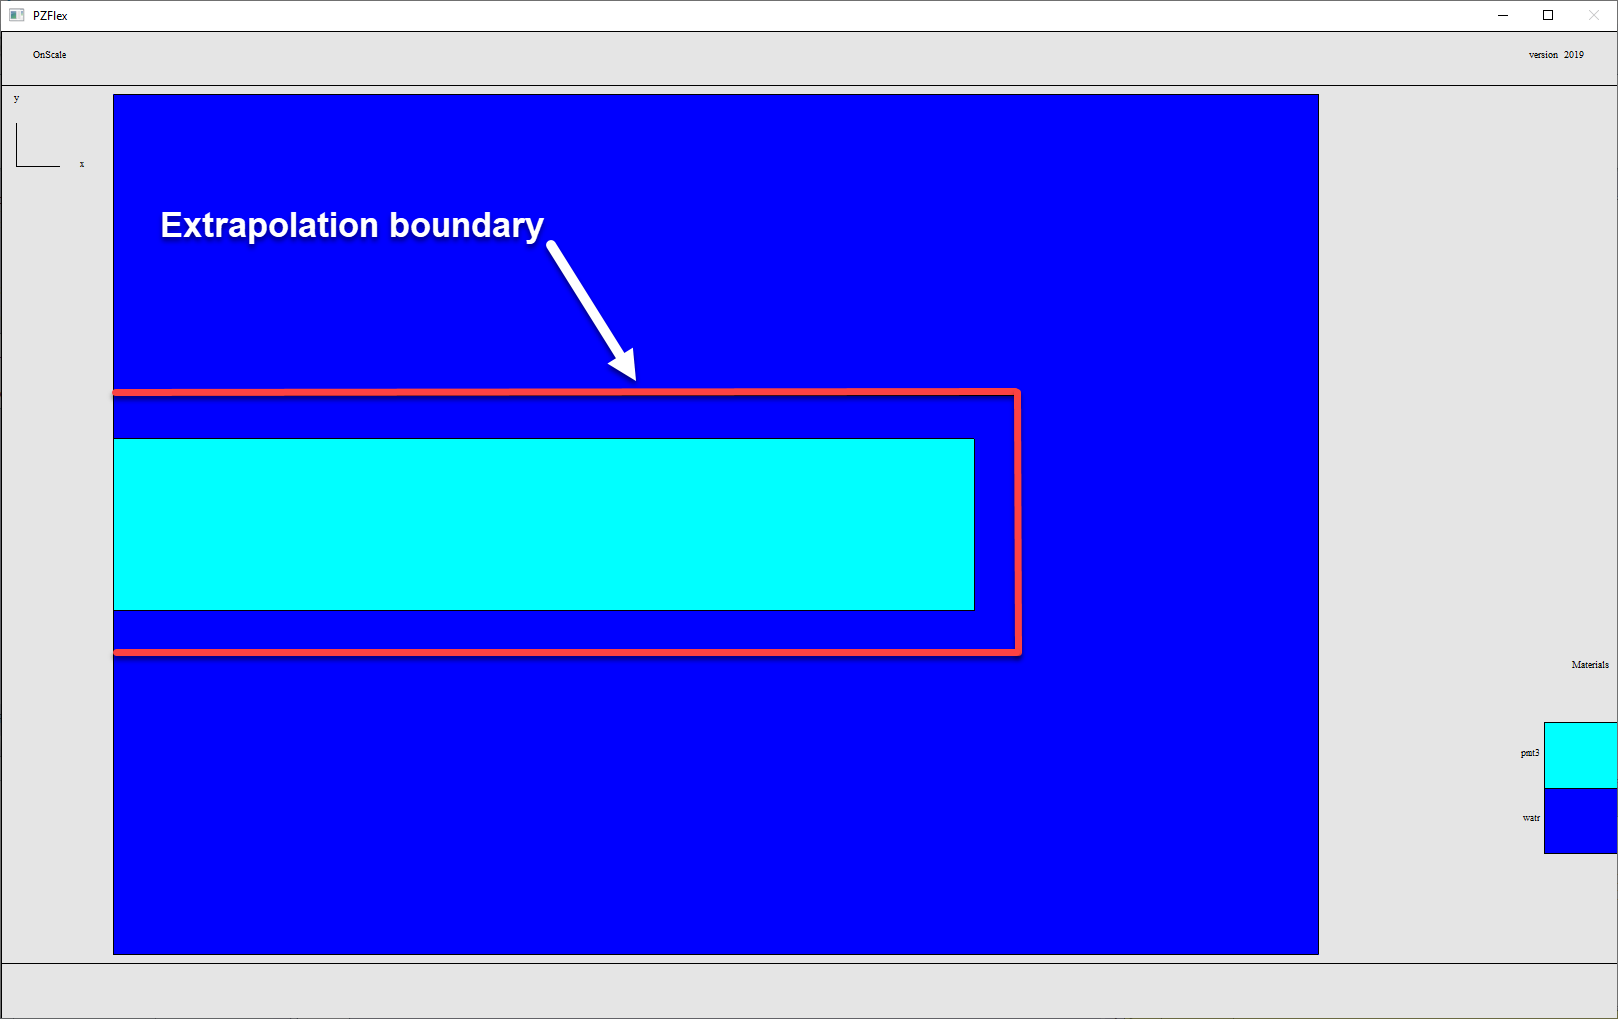
Download: PZT Disc with Extrapolation Boundary
Here's a sample result file for extrapolation:
Download: PZTDisc.flxext Extrapolation Result File
Note: The extrapolation boundary can also be defined as a simple cut plane rather than 3 lines which go around the whole PZT. The only important thing to remember is that the extrapolation boundary cut plane cannot go through PZT material, it has to be placed outside of the piezoelectric material.
Example 1: Beam Field plot
The following script generates an extrapolated beam field plot:
mp omp * *

symb xmin = 0.
symb xmax = 0.575
symb ymin = 0.
symb ymax = 3.

symb nx = 80
symb ny = 40
symb ntot = $nx * $ny

grph type stnd

extr
	slvr freq
	freq 10e3
	data PZTdisk.flxext
	file f1
	type amp
	surf quad * $nx $ny $xmin $ymin 0. $xmax $ymin 0. $xmin $ymax 0. $xmax $ymax 0.
	calc 1
	end

grph
	nvew 2 1
	mirr x
	mirr y
	plot f1/pf:m1
	plot f1/pf:p1
	end
term
Download: Beam Field Plot Extrapolation Script
Here's the result:
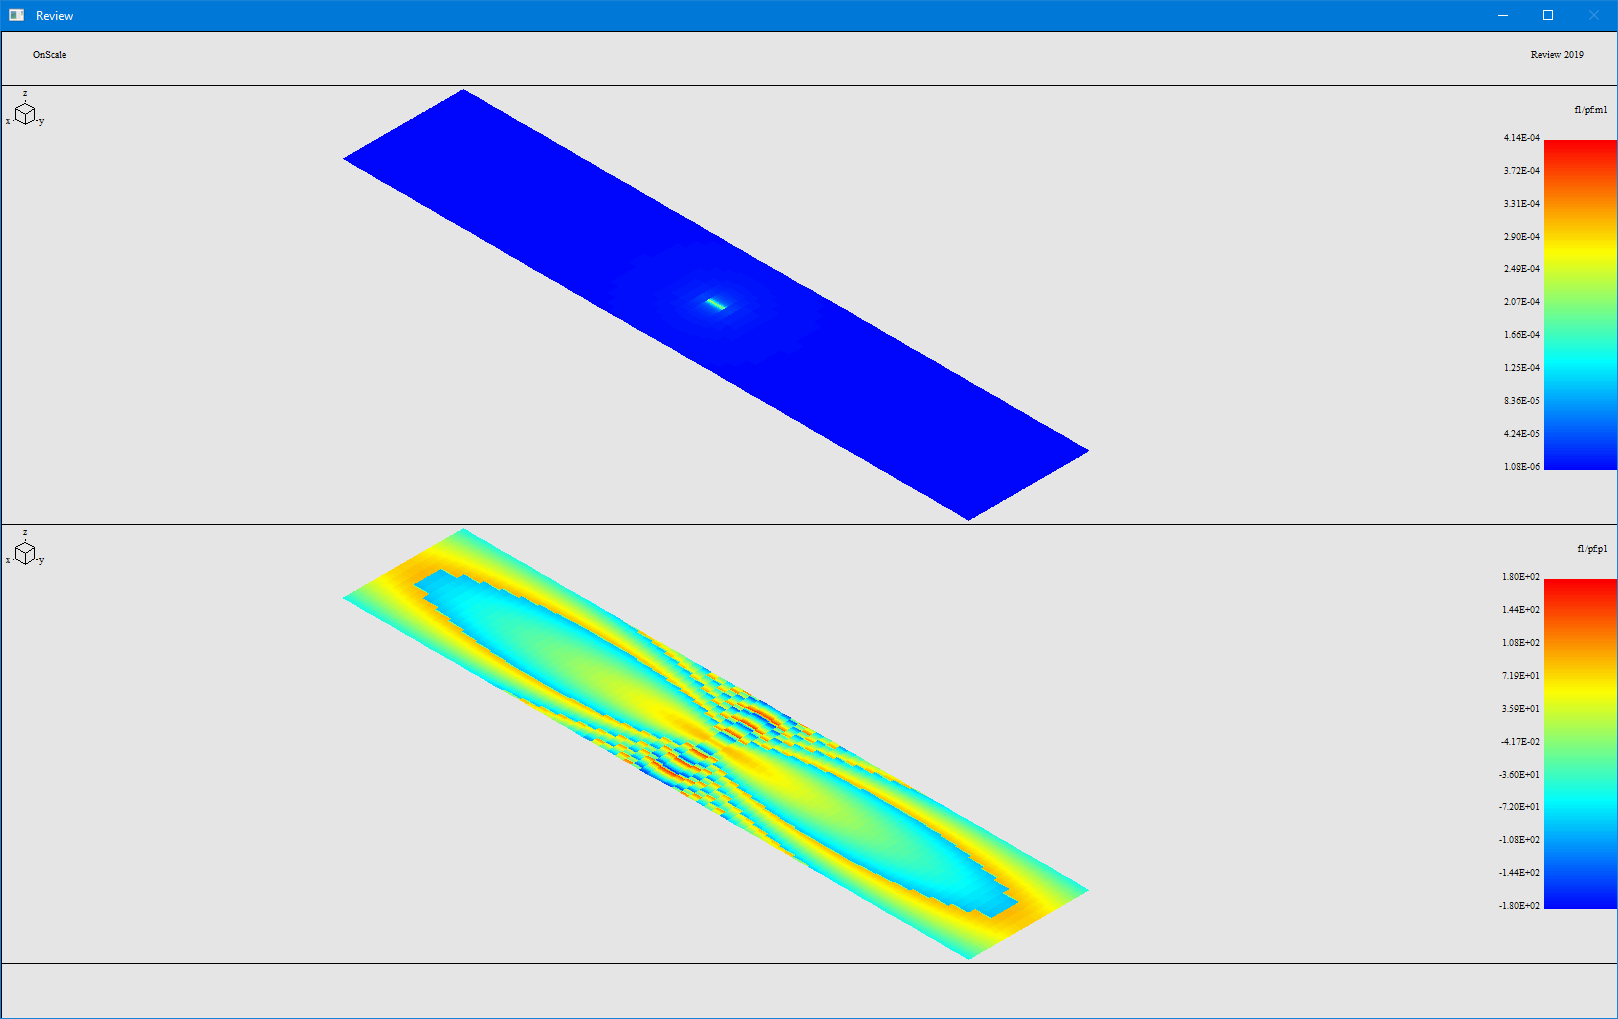
Note: you can change the resolution of the extrapolated grid by increasing nx and ny.
Example 2 - Extrapolated Radial Beam Plot:
The following script provides the extrapolated radial beam plot.
The data cddo command is used at the end of this script to export the data into a csv file.
/* Use multiple processes
mp omp * *

/* Set job name
text jname = 'PZTdisk'

c **************************************************************************************
c Inputs
c **************************************************************************************

/* Geometry
symb freq1 		= 10e3					/* Frequency of Radiation Pattern
symb radius 	= 10.                	/* radius of extrapolated line -  10m for farfield
symb strtang 	= -90.               	/* first angle
symb endang 	= 90.                	/* final angle
symb nang 		= 361              		/* number of angles to calc
symb astep 		= ( $endang - $strtang ) / ( $nang - 1 )

c ORIGIN point for directivity plot
symb x_origin = 0.0
symb y_origin = 0.0
symb z_origin = 0.0

axis
	/* Configured for Y Axis Propagation
	defn beam_horz cyl2  $x_origin $y_origin $z_origin 1. 0. 0.    0. 1. 0.
	defn beam_vert cyl2  $x_origin $y_origin $z_origin 0. 0. 1.    0. 1. 0.
	end

c **************************************************************************************
c Beam Horz
c **************************************************************************************

/* Perform beam extrapolation in frequnecy domain
extr
   slvr freq
   freq $freq1
   type amp                     /* Amplitude
   data $jname.flxext           /* Read in extrapolation data
   file e1 cler        			/* name output file
   surf cyln beam_vert $radius 0. 0. 1 $strtang $endang $nang
   calc 1 						/* calculate
   end

/* Create angle axis
data open angl 2 1 $nang 1 f
do loopI I 1 $nang 1
	symb ang = $strtang + ( $I - 1 ) * $astep
	symb #set $ang angl 1 $I
end$ loopI

/* Get log beams
symb #get  { bmax1 } datamax e1/pf:m1

data
	math dBbeam1 = 20 * alog10 ( { e1/pf:m1 }  / $bmax1  )
	end

/* Plot dB beams
grph
	plot dBbeam1 vs angl
	end
term

c Custom Code - Search for Threshold Cutoff
symb dB_cutoff = -3						/* Decible Cutoff for Beamwidth
symb #get { * * ij * } datamax dBbeam1 /* Find Peak amplitude Index

	do loopI I $ij $nang 1

		symb #get { value } array dBbeam1 1 $I

		if ( $value lt $dB_cutoff ) then
			symb beamwidth = ( ( $I - $ij - 1 ) * $astep * 2 )
			symb #msg 1
			Beamwidth: $beamwidth degrees
			goto outloop
		endif
	end$ loopI

end$ outloop


c **************************************************************************************
c Outputs
c **************************************************************************************

/* Write all beams to data files
data
	/* Beam 1
	open dBbeam1f 2 2 $nang 1 f
	cpyg angl 1 1 1 1 1 1 dBbeam1f 1 1 1 $nang 1 1
	cpyg dBbeam1 1 1 1 1 1 1 dBbeam1f 2 2 1 $nang 1 1
	cddo dBbeam1f Beam_$freq1.csv

stop
Download: Radial Beam Plot Extrapolation Script
Here's the result from that script:

Example 3 - Time Domain signal extrapolation
Here is an example of a script to extract a time domain signal and to save the extracted data into a csv file:
mp omp * *

symb xmin = 0.
symb xmax = 0.575
symb ymin = 0.
symb ymax = 3.

symb nx = 3
symb ny = 3
symb ntot = $nx * $ny

grph type stnd

extr
	slvr time
	data PZTdisk.flxext
	file f1
	type amp
	surf quad * $nx $ny $xmin $ymin 0. $xmax $ymin 0. $xmin $ymax 0. $xmax $ymax 0.
	calc 1
	end

c Building Time Column
make
	file f2
	symb #get { ts } curvdelx f1
	symb #get { nval } curvnval f1

	do loopi I 1 $ntot
		symb #get { tbeg } curvxmin f1 $I
		time $nval $tbeg $ts
		curv { f1 $I }
	end$ loopi
	end

grph
	do loopi I 1 $ntot
		plot f2 $I
		writ onex 'EXTR_$(I).csv'
term
	end$ loopi
	end
Download: Time Domain Extrapolation Script
Here is the result of this script:
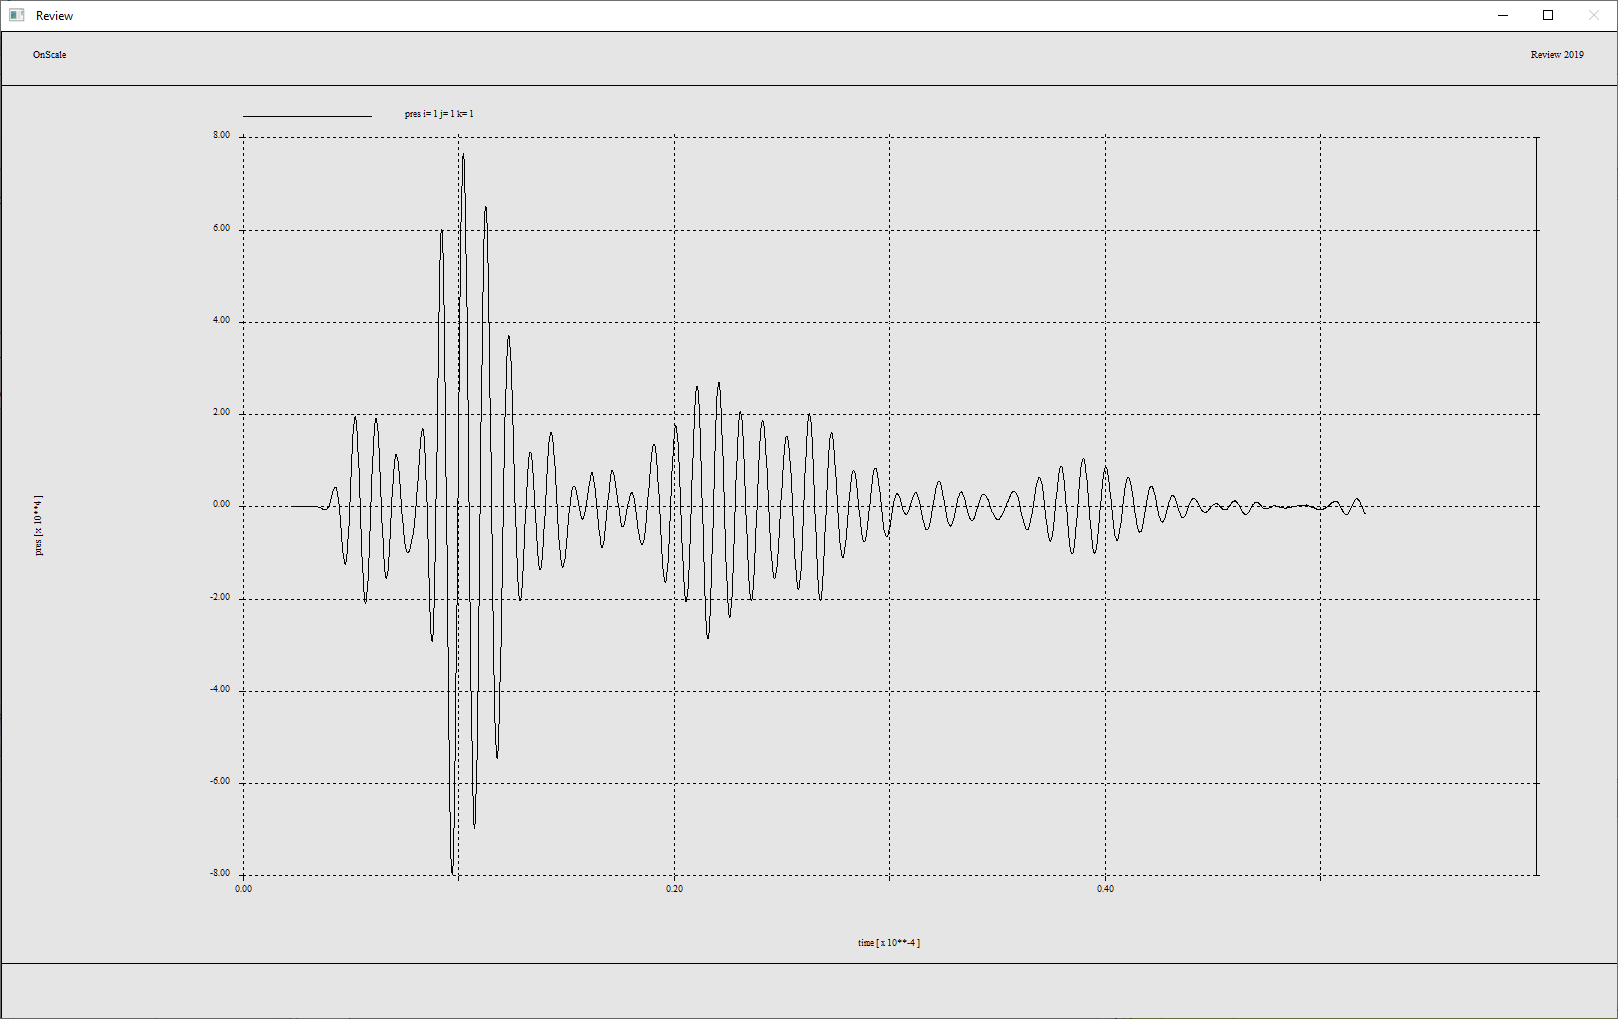
Note: For time domain signal extraction, the time column has to be rebuilt and data has to be written one by one in a file using a loop.