Model Description
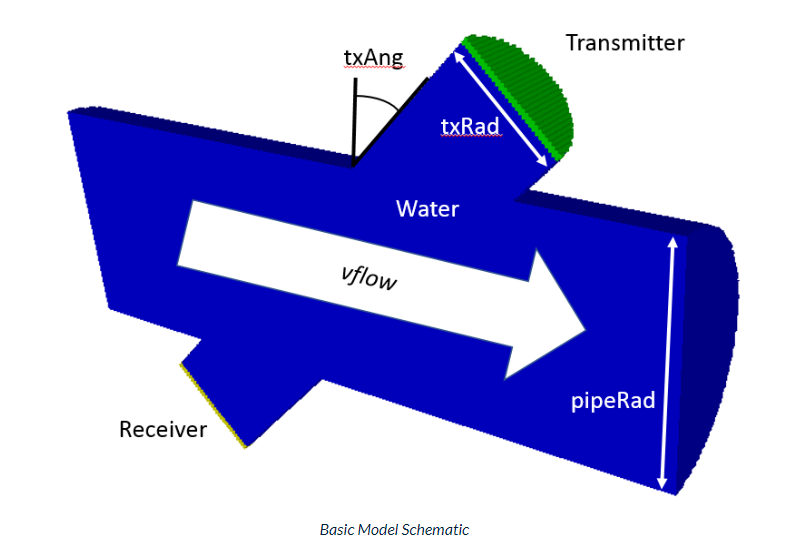
A 3D model of a pipe with a parabolic flow profile in Y direction across the radius of the pipe. With the flow velocity set in positive X direction, the model can be used to evaluate the effect of flow on the receive signal and severity of beam deflection.
Important: This is not a CFD analysis. A flow field is loaded in the background and its influence on the acoustic wave is studied.
Download and Open the Model
OnScale Input Files have the file extension *.flxinp. To open the downloaded file:
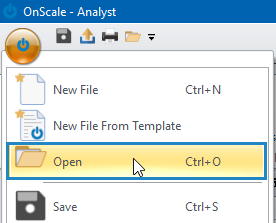
- Open OnScale
- Select Analyst Mode
- Select the Menu button in the top left of the application
- Select Open
Preview Model
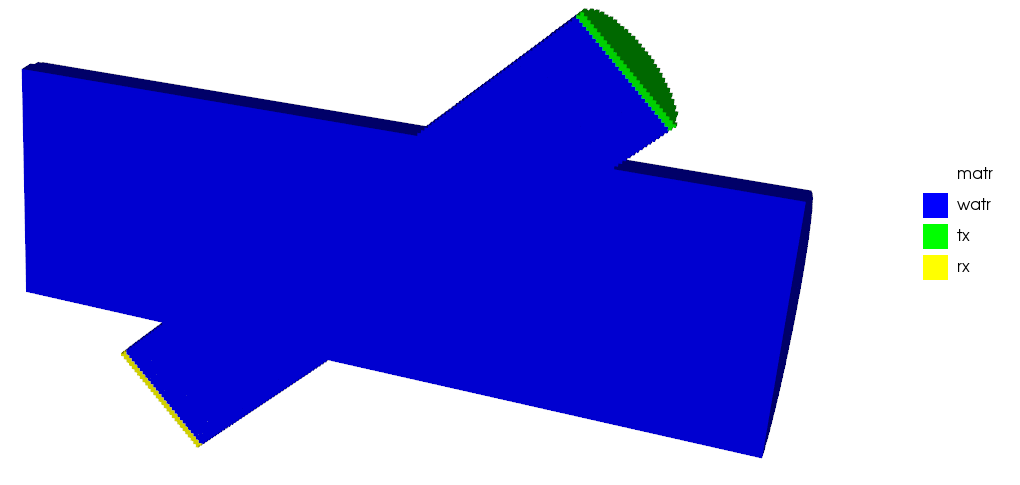
Preview model is used to view the geometry dimensions and material assignment of a model to ensure the script is correct. To preview a model, select the Preview Model icon in the Home tab of the application ribbon.
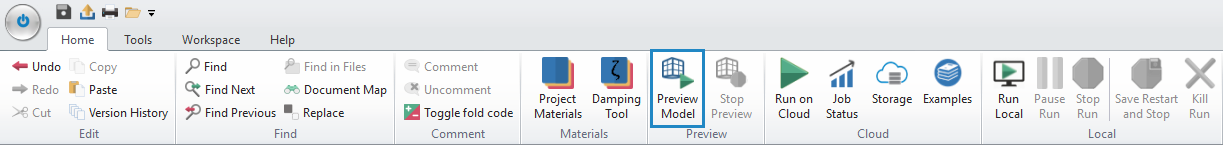
Note: Preview model will display data from any grph commands that come before the prcs command. If you have more than one grph command, you can cycle through the graphics by continuously selecting Preview Model. To close the preview, select Stop Preview.
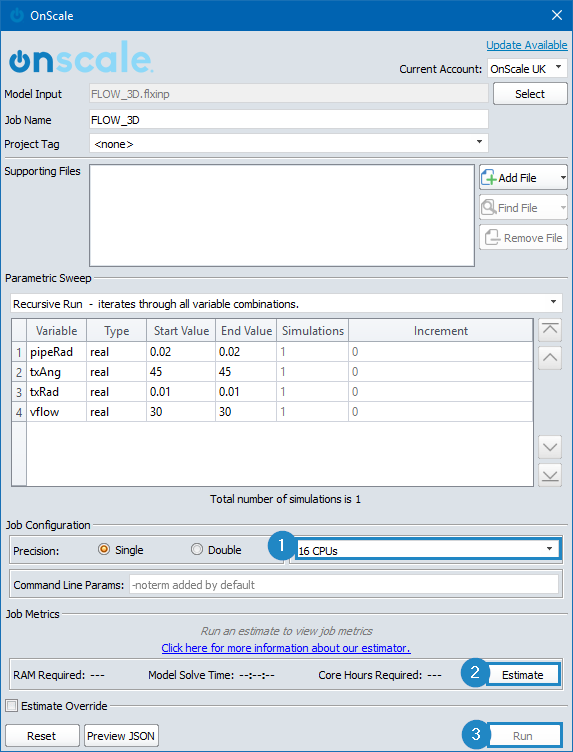
Run Model on Cloud
To run the model on the cloud, select the Run on Cloud button in the Home tab of the application and follow these steps:
- Select 16 CPUs
- Select Estimate
- Select Run
Download Results
- From the Home tab, select the Storage icon
- Select the Refresh icon to refresh storage
- Select the Job Name from the dropdown menu
- Select the Download button
- Select Download All
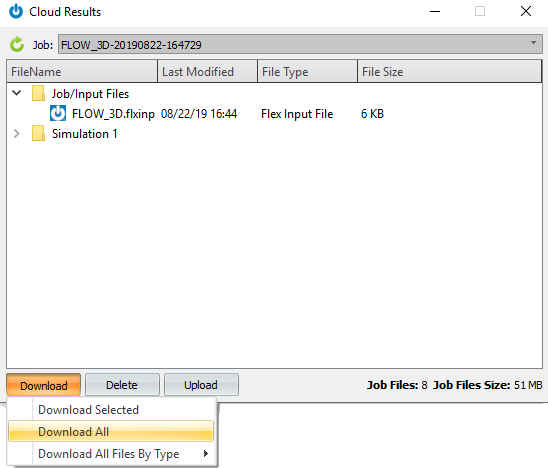
Choose a directory to download the results to. These results will be stored in the folder: Flow_3D-YYYYMMDD-HHMMSS\1 where YYYYMMDD-HHMMSS is the current date and time.
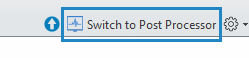
Switch to Post Processor
Post Processor is a suite of tools used to visualise and analyse output data generated from OnScale simulations. Switch to Post Post Processor.

What kind of analysis can I do in Post Processor? Find out here.
Analyse Results
To plot the pressure signal measured at the receiver, follow these steps:
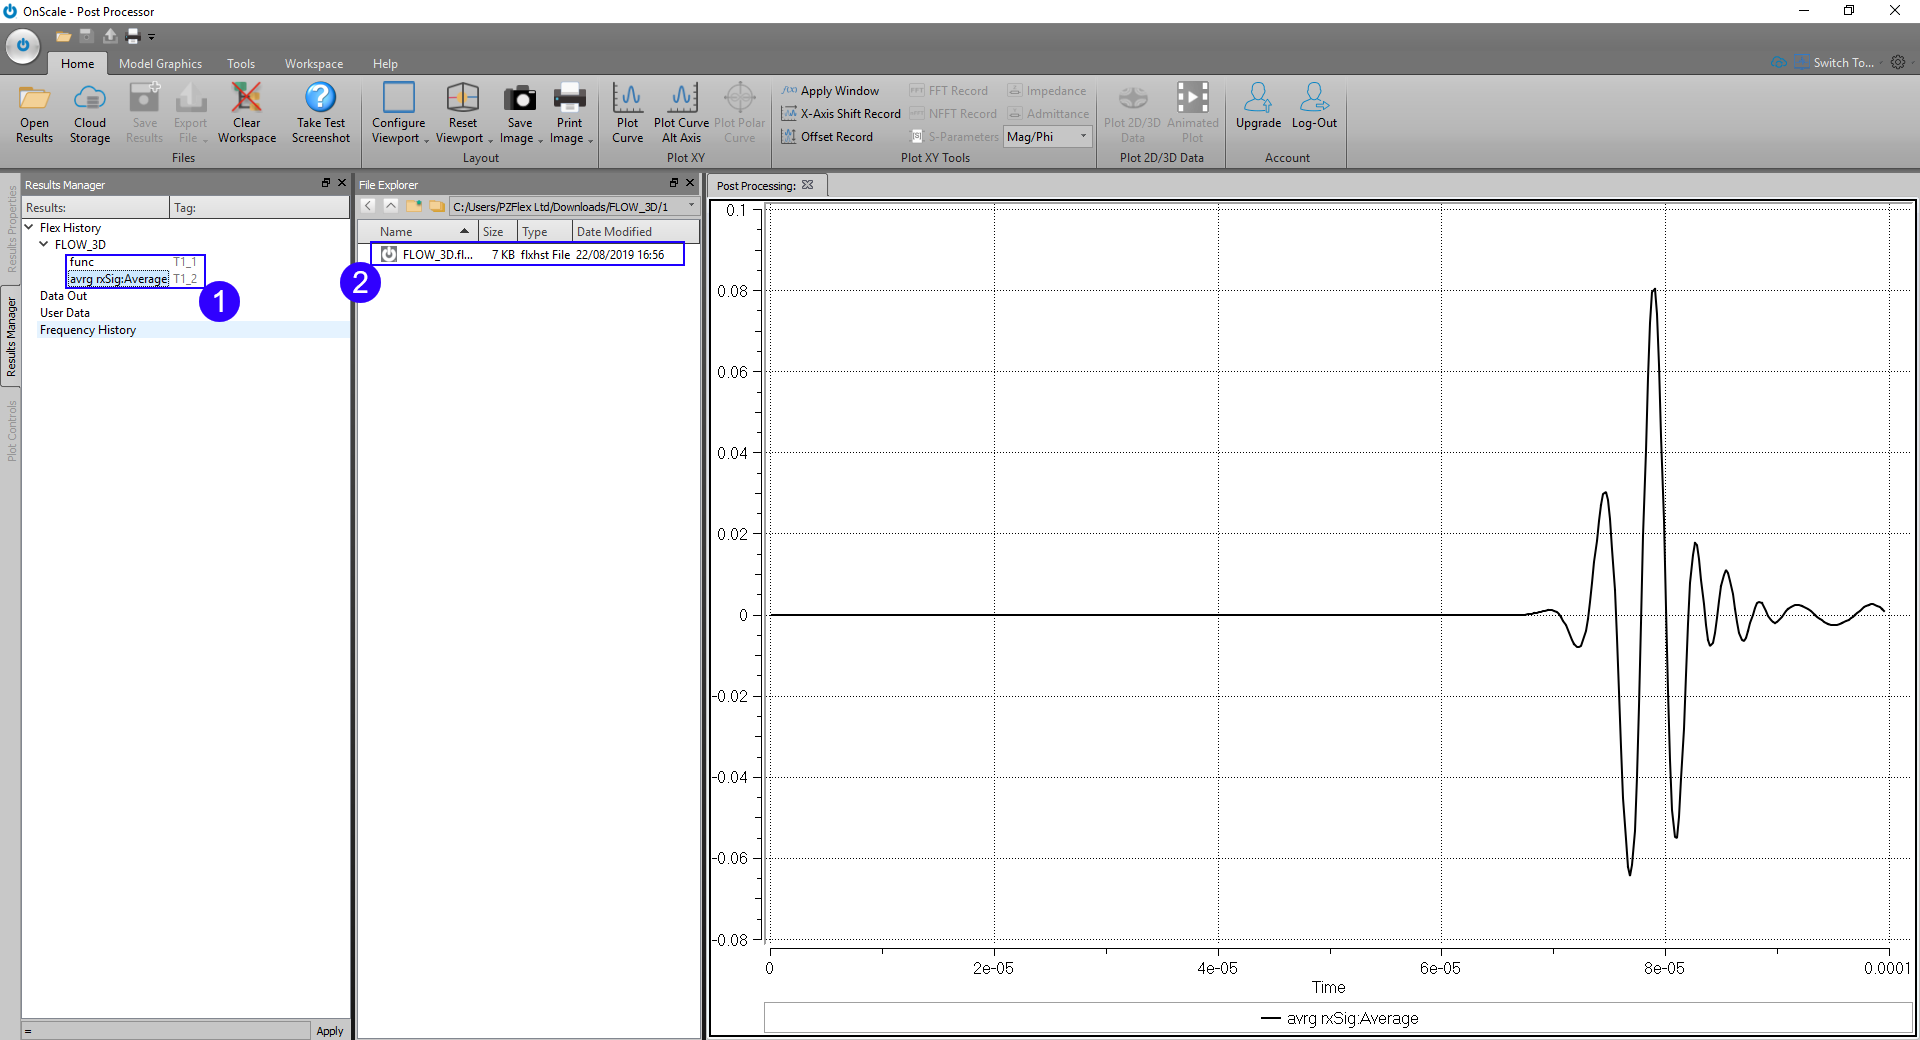
- In File Explorer, navigate to the download directory and double click the file 'Flow_3D.flxhst' to open it
- In Results Manager, select the time average 'avrg rxav:Average' by left clicking it