In this example, you will simulate a simple optical splitter demonstrating evanescent wave coupling and analyse the effect wavelength has on the output energy.
What is evanescent wave coupling?: When a wave propagates in a waveguide near another waveguide, due to the leaking fields a second wave is excited in the neighboring waveguide.
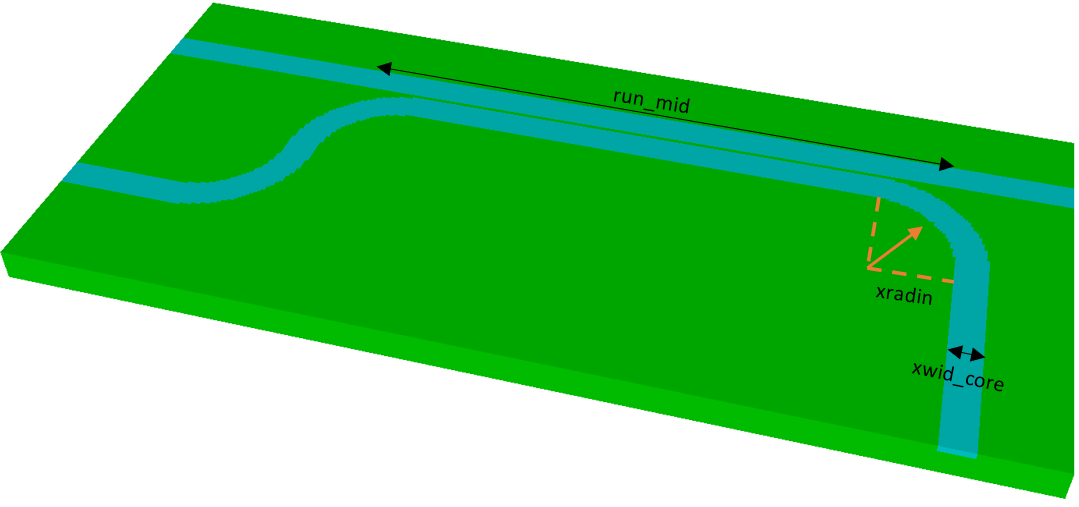
Model Description
This is a simple model of an optical splitter with two waveguides, the original signal is launched at the top waveguide from the right and coupled to the bottom waveguide.
Download and Open the Model
Download: Evanescent Waveguide Coupler Files
OnScale Input Files have the file extension *.flxinp. To open the downloaded file:
- Open OnScale
- Select Analyst Mode
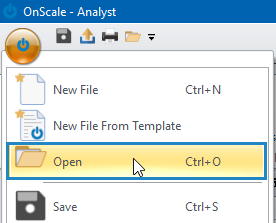
- Select the Menu button in the top left of the application
- Select Open
Preview Model
Preview model is used to view the geometry dimensions and material assignment of a model to ensure the script is correct. To preview a model, select the Preview Model icon in the Home tab of the application ribbon.

Note: Preview model will display data from any grph commands that come before the prcs command. If you have more than one grph command, you can cycle through the graphics by continuously selecting Preview Model. To close the preview, select Stop Preview.
Run Model on Cloud
To run the model on the cloud, select the Run on Cloud button in the Home tab of the application and follow these steps:
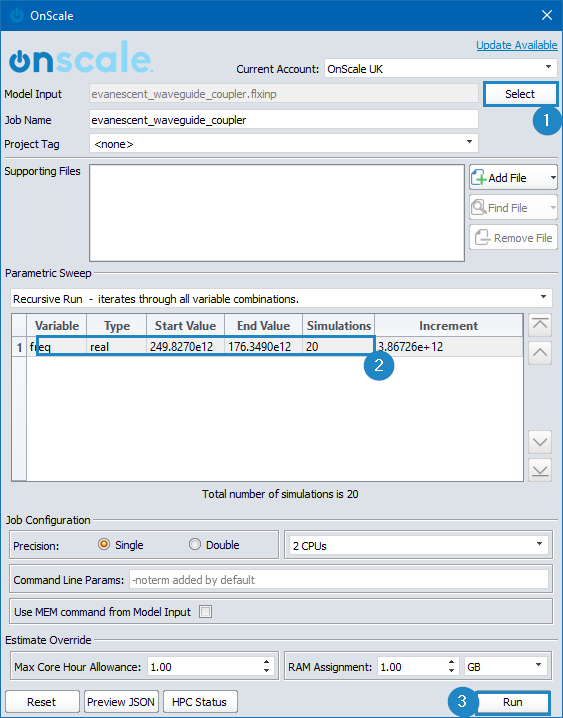
- Click Select and open the file you wish to run (evanescent_waveguide_coupler.flxinp)
- For variable freq set the Start Value to 249.8270e12, End Value to 176.3490e12 and Simulations to 20
- Select Run
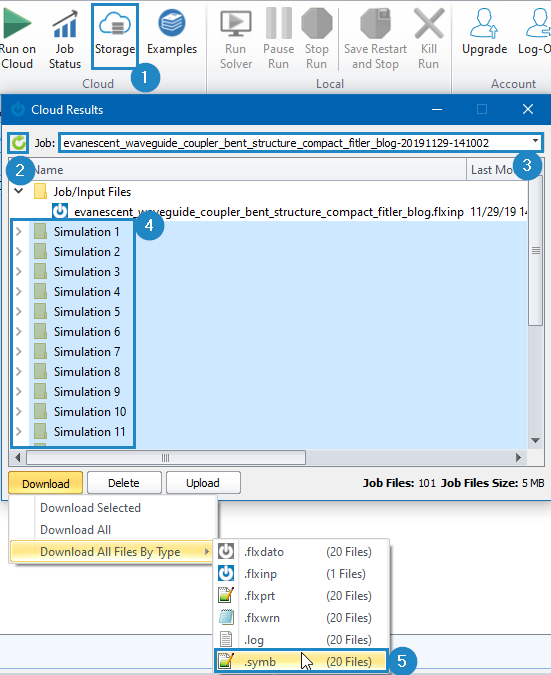
Download Results
- From the Home tab, select the Storage icon
- Select the Refresh icon to refresh storage
- Select the Job Name from the dropdown menu
- Select all Simulation folders
- Select Download > Download All Files By Type > .symb
Choose a directory to download the results to. These results will be stored in the folder: evanescent_waveguide_coupler-YYYYMMDD-HHMMSS where YYYYMMDD-HHMMSS is the current date and time.
Analyse Results
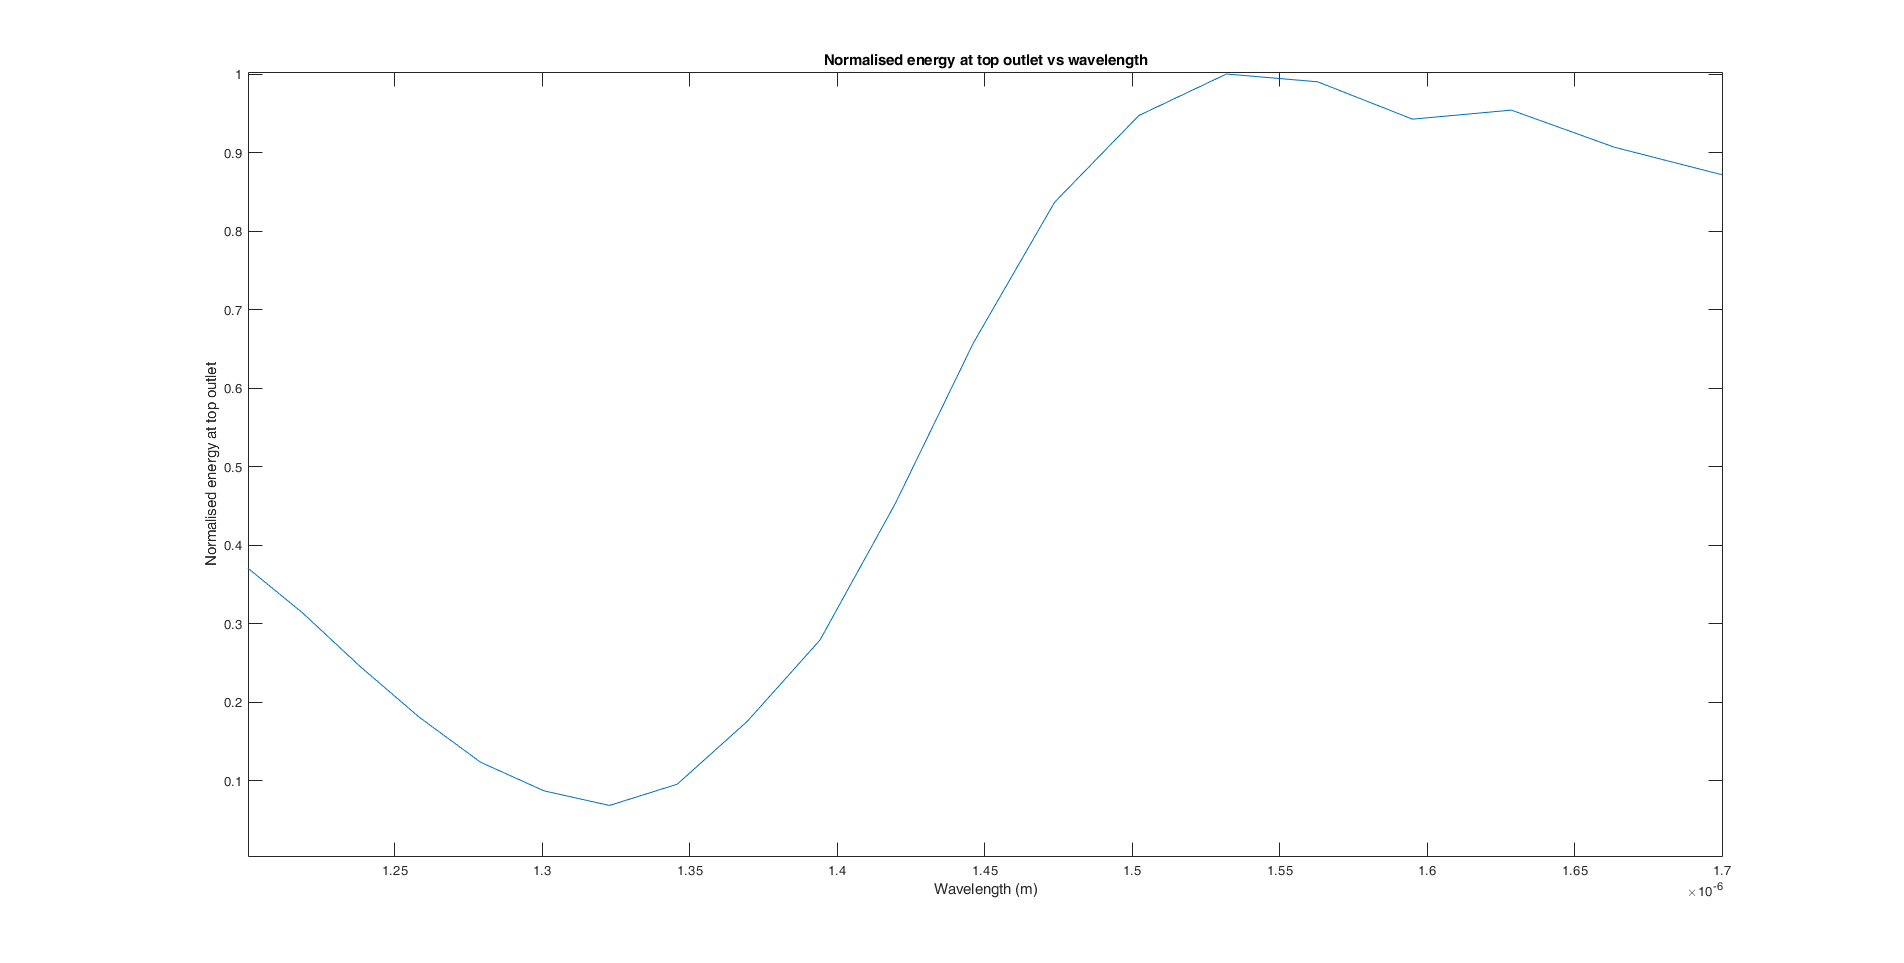
The output energy at the top waveguide over the total energy was plot against wavelength in MATLAB to see the effect of wavelength on output energy.
- Open 'energy_vs_wavelength.m'
- Insert the name of your downloaded results folder into variable FIn
- Select Run