
This example shows how to produce dispersion curves in an aluminium plate using a review script.
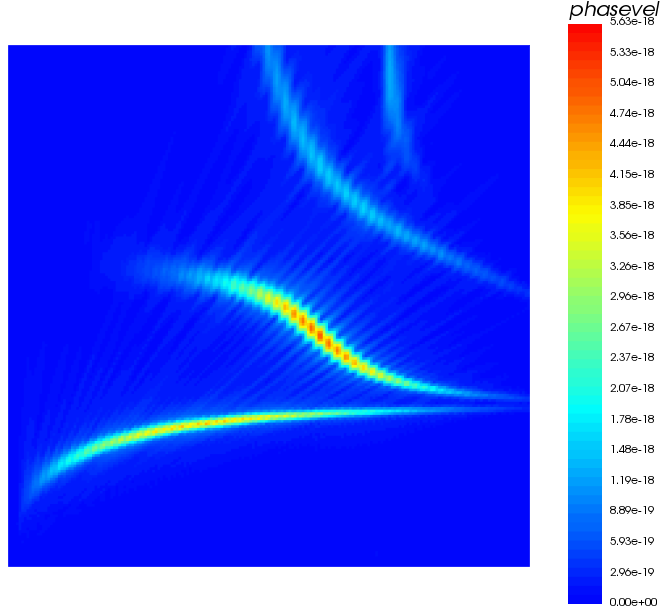
Dispersion curves obtained from OnScale results in phase velocity against frequency representation.
Plate waves are similar to surface waves except they can only be generated in materials a few wavelengths thick. Lamb waves are some of the more commonly waves used in Non-Destructive Testing (NDT), they are complex vibrational waves that propagate parallel to the surface of the material throughout it's thickness. Lamb waves exhibit velocity dispersion; their velocity of propagation is dependent on the frequency and the elastic properties and density of the test material. Lamb waves are generated at an incident angle in which the parallel component of the wave velocity in the source equals that of the test materials velocity.
The two most common modes of particle vibration are symmetrical and asymmetrical and are commonly denoted as S0, S1,...SN and A0, A1,...AN respectively.
Outputs
- Time Histories (XY Graphs)
- Drive input signal
- Y Displacement recorded every 5 elements along the x-axis
Runtime Statistics
|
Model size |
360000 elements |
|
Solve Time |
60 s (2 CPU) |
|
Core Hours |
0.024 |
|
Memory Usage |
74 MB |
|
Recommended CPU Configuration |
2 CPU |
Review
Accompanied with this example is a review script (.revinp), once the input file has run to completion, download the flex history output and open the attached review file in the same directory to post process locally. This will perform a 2-D Fourier Transform (FT) on the resultant time histories generated. The 2 plots generated will display the dispersion curve shown above as well as the dispersion curve plotted in the wave number vs frequency representation.
Files
The following input files are required to run this model, click here to download the input files: