
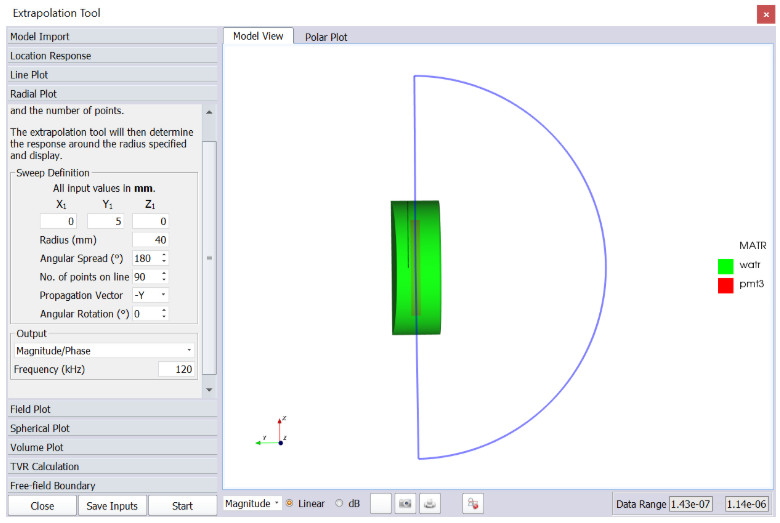
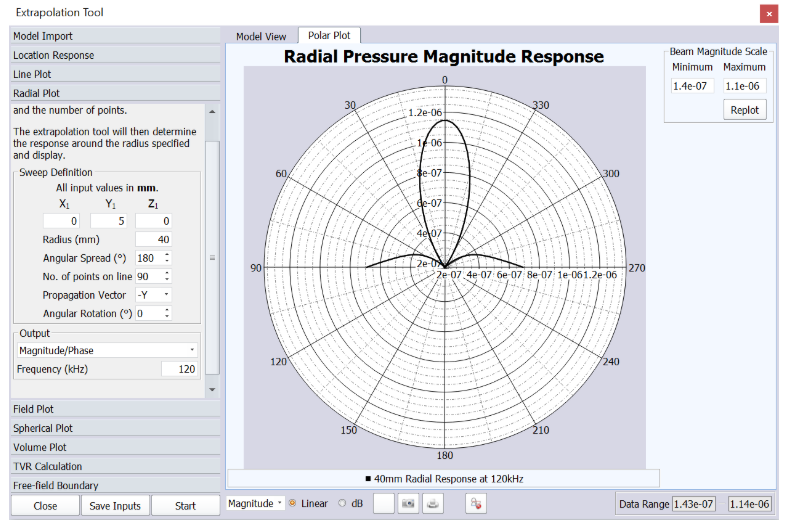
Radial plots or directivity plots are a useful method of determining the direction the device is most sensitive in. The tool offers a quick and easy way to extract this performance metric. The Radius of the radial plot can to set to dictate how far the radial plot will extend in the propagation direction. The Angular Spread option is used to choose the angle which the arc of the radial plot will cover for the calculation. The Propagation Vector should match the direction at which the device projecting the wave. The user must enter a drive frequency before the radial plot can be calculated and will be shown on the screen, giving the user the opportunity to change the y-axis to a logarithmic scale, print the radial plot or save the plot as an image/data file export(.csv). Clicking on the data legend will allow changes to be made to the plot (similarly to previous plots in the toolkit).
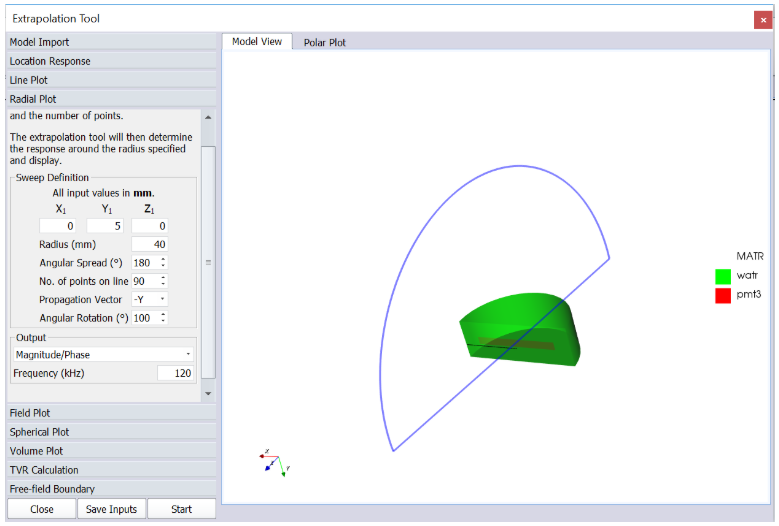
The Angular Rotation option allows the plane of the radial analysis to be rotated around the propagation vector. This is useful for obtaining beam patterns on different axis planes, such as azimuth and elevation (alternatively horizontal or vetrical).
Another useful feature is the Beam Info display, which shows the beamwidth of the device at both -3dB and -6dB levels. It can also be used to specify a user defined plotting scale by entering minimum and maximum scale values and pressing the Replot button.