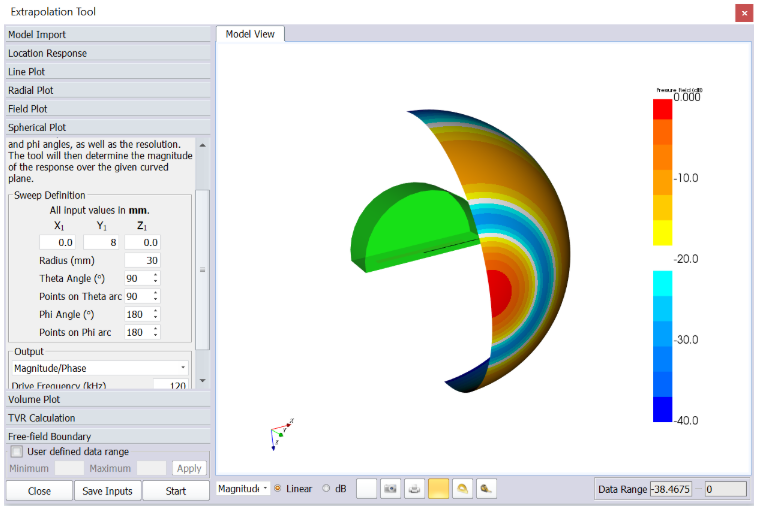
The spherical plot generates a ‘shell’ of pressure data around your device.
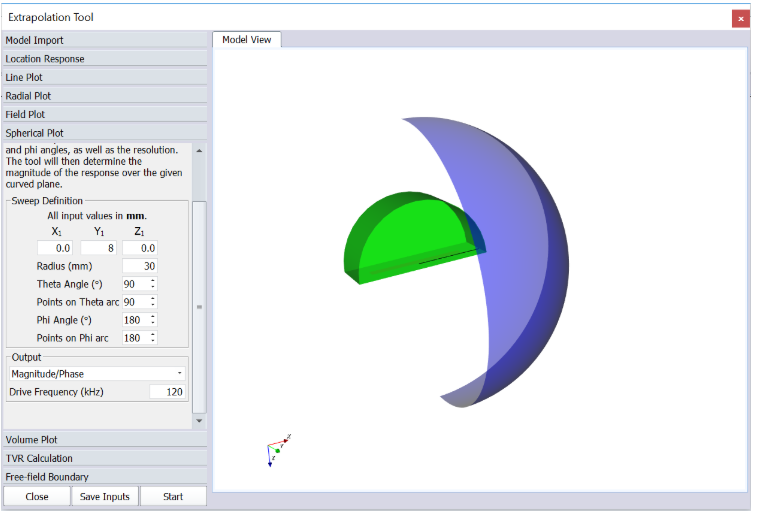
The XYZ parameters shifts the centre point of the sphere within the 3D space of the model (referenced from the Global Origin). The Radius controls the spherical radius. There are 2 angles which sets the segment of the sphere’s shell which pressure data will be calculated for:
- Theta Angle dictates the angle progressed around the Z-axis (range — 0 to 360)
- Phi controls the angle progressed around the X-axis (range — 0 to 180)
The Points on Theta arc button can be used to set the resolution settings for the corresponding angle directions to generate the grid system around the shell of the sphere. The drive frequency can be set at the bottom and the spherical plot can be generated. All the general tools are available along with the angle and distance measuring widgets.